School of Science and Technology 科技學院
Computing Programmes 電腦學系

Graph Embeddings for Predicting Traffic Accident Black Spots

Lo Ka Ho, Cheng Wang To, Cheung Hang Tak

  
ProgrammeBachelor of Computing with Honours in Internet Technology
SupervisorDr. Andrew Lui
AreasAlgorithms
Year of Completion2021
AwardFirst Runner-up of IEEE (HK) Computational Intelligence Chapter 18th FYP Competition

Objectives

The aim of the project is to use observational data to build a deep machine learning model to model the relation between the accident proneness and road network structure design, road installations, and road local properties. In conclusion, this model provides a basis for improving the conditions of traffic facilities and enhancing traffic safety.

1. Collect the accident and road infrastructure data
It is of the utmost importance to collect related data as the machine learning model needs to learn the function from data. Our model is to comprehend the connection between traffic accidents and road network design, so obtaining accident data as well as the road structure data is the foundation of the whole model. Therefore, collecting and organizing the data on traffic accidents in the Transport Department and News Feed like RTHK, and the data of road network data in OpenStreetMap are needed.
2. Develop and evaluate the feature set that defines road infrastructure design.
Defining low-level features of road infrastructure design is the next step. Low-level features may include the road maximum speed, inclination, bending angle, the number of road lanes, the state of in-out lanes, and so forth.
3. Develop and evaluate the accident model
An accident should be defined. It can be classified by different severity and a specified area. Besides, only the factors caused by the road infrastructure design per se will be considered, neglecting other reasons like human mobility.
4. Optimize the machine learning model for predicting the proneness of accidents
Hyperparameter optimization and tuning are crucial so that the function can be used to do traffic accident risk prediction after building the machine learning model.

Methodologies and Technologies used

  1. Definition in Road Network
Typically, a road network is modeled as a directed graph, which contains intersections or points of location as nodes as well as road segments as edges. What is more, both nodes and edges consist of not only the geospatial information such as the coordinates, but also the information of road network structure, road installations and road characteristics like traffic signals, number of lanes, and road types. This information could be useful for predicting the accident proneness of a location.
  1. Deep Learning and Feature Extraction
Extracting useful or effective latent features is difficult and complicated for machine learning. Feature engineering often requires a lot of time but is not effective in finding the hidden features. Deep learning can extract the latent features from simple features to form more abstract high-level representations to find the distribution of data-style feature expression by combining low-level features (Alex Krizhevsky et al., 2017).
  1. Graph Embedding for extracting the structural information from a graph or network
As stated in point 1, a road network is commonly modeled as a directed graph including a set of nodes and edges, and a directed road segment or an edge is allowed to travel from a start node to end node generally. Such graph representations make graph embedding methods such that it could be extracting structural information or features from road networks. In graph embedding, it is supposed to build a model to learn the representations which embed nodes in networks into a d-dimensional vector space in a way that the nearby nodes of the self node in the network are mapped to feature vectors encoding the structural information of the graph (Tobias Skovgaard Jepsen et al., 2018). Simply put, graph or network embedding can extract the structural information in networks and form a representation of the self node.
  1. Node2vec for learning intrinsic properties of a road network structure of a node
Node2vec, which is a deep learning or graph embedding technique, is used in this project. It learns useful latent feature vectors or embeddings of the road network structure as inputs to machine learning or data mining algorithms. In addition, node2vec aims to learn node embeddings but attach importance to the issue of sampling the network neighborhood relationship by applying parameterized random walk instead of uniform random walk. The two parameters are parameter p in and out parameter q, controlling the walking process by the probability of returning back to the previous node, or selecting the next node away from the previous node in order to simulate Breadth-First Search and Depth-First Search respectively (Aditya Grover & Jure Leskovec, 2016). In other words, the trained node2vec model can generate a node embedding, which represents the node capturing intrinsic properties of road network structure, that is the probabilities of reaching the corresponding nodes in random walks of the self node. At the end, by checking the structure similarity or the probabilities between self node and other nodes, node2vec can do clustering so that the similar nodes will be grouped together as one group. 
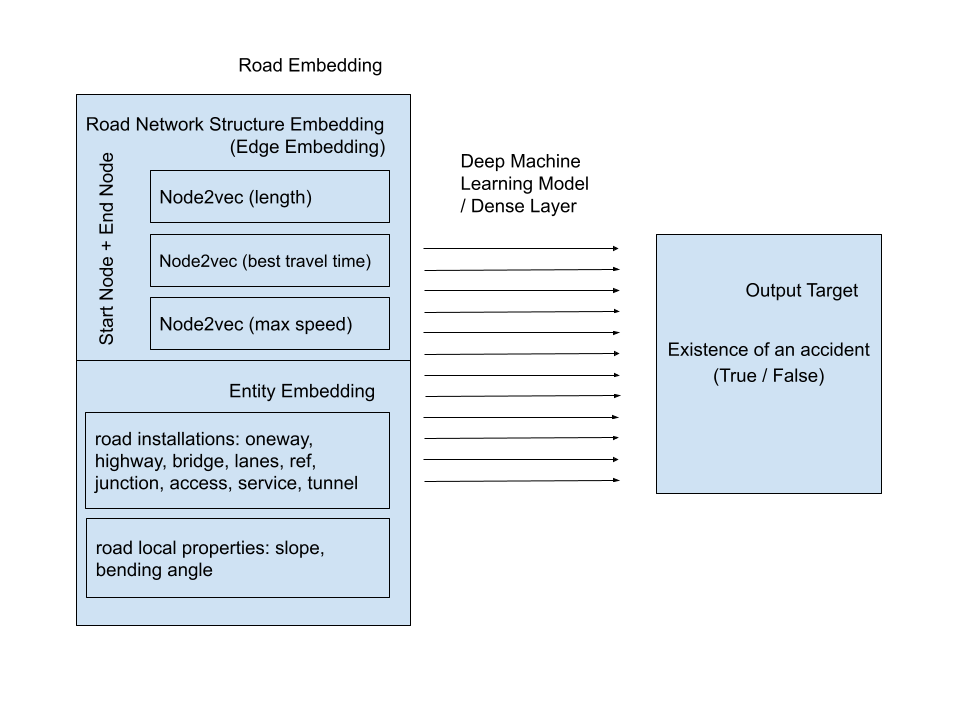
Node2vec can learn a node embedding, but an edge can be embedded by aggregating the embeddings of the start node and end node of the edge. By concatenating the embeddings of its start node and end node, that edge embedding could be represented as a road segment in the network. (Tobias Skovgaard Jepsen et al., 2018)
  1. Neural Network in the prediction of accident proneness from road infrastructure design
A Neural Network consists of many simple and connected processors called neurons (Schmidhuber, J., 2015). It mimics the operation of the human brain. Neural Networks can adapt to changing the input to perceive the environment by activating the input neurons. Other neurons get activated through weighted connections from previously activated neurons. Through the backpropagation, the loss of the model will be minimized. Therefore, a neural network can learn the rules of the model itself instead of hand-crafting. Artificial Neural Network (ANN) or the dense layer is based on this concept. Our classifier (deep machine learning model) is the dense layer. After inputting the road network structure vectors, road installations and local properties (e.g. slope and bending angle) into the classifier, the proneness of accident will be outputted.
  1. Classification in the deep machine learning model
There are several machine learning models that can be used in Classification. In this project, we use a variant of logistic regression. In logistic regression, a linear equation with optimized coefficients is to be found to give a decision boundary which can be used to classify the featured data into 2 classes. Then, the linear equation is transformed by the sigmoid function and its output is between 0 and 1 which is a probability value that maps to different classes. Logistic function can be described as P(Z) = expZ/(1+expZ). P behaves like the distribution function of a symmetrical density, with mid-point zero; as Z moves through the real number axis, P rises monotonically between the bounds of 0 and 1. (J.S. CramerIt, 2002). It uses cross entropy as a loss function and minimizes the loss function by gradient descent. In order to increase accuracy of the result, we use keras deep learning model which contains 10 input layers and 11 dense layers and the output layer is softmax. Different from logistic regression, we can adjust the number of neurons of the hidden layer which is more flexible for us to construct a more complex deep learning model.
  1. Web Crawling for extracting accident news
The graph embeddings for predicting traffic accident blackspots need lots of data to do the data analysis. The public is the user of the road, so the source of the traffic accidents should come from the daily life of the people. Therefore, the news of traffic accidents that happen every day is the closest data used for analysis. Also, the news contains much useful information about traffic accidents, such as location, time, and so on. This information can also be used to extend and analyze with other data. Web crawling is a tool that can crawl the content of the target website automatically. This can help collect an amount of news of traffic accidents from different news websites. The appropriate data that needs to be used as analysis data is to be defined before starting to collect the data from various websites, such as which types of news are suitable as sources. Afterward, search and filter the source of the news of different websites from the search engine. Then, define the depth and the breadth of the news. For example, the range of the time of the news (the past ten years traffic accidents news) and the detail of the news (severity of the traffic accidents), etc. A focused crawler is one of the methods of crawling, which is a web crawler that collects Web pages that satisfy some specific property, by carefully prioritizing the crawl frontier and managing the hyperlink exploration process (Chakrabarti, Soumen, et al., 1999). The crawler can focus on crawling the specific time range for the news of traffic accidents. The raw data can be stored in databases after getting it from news websites. Finally, clean the dirty data in the databases to build a new dataset, and extract the content and the details from the new dataset for the data analysis.

A. Design of the model

Figure 1: Architecture of the deep machine learning model

There are mainly three parts of the model, which includes input parameters, the deep machine learning model as well as the output target. The methodologies of each component are shown as follows.

B. Data Collection

After choosing the desirable area, we collected the data from OpenStreetMap about the map structure in this specific area. There are two main types of data provided by OpenStreetMap. The first type is node data, which describes the features and information of the concatenate point between roads. For example, the data contains the street count and the geographical information of the node. Another type of data is edge data, which describes the features and information of the road on the map. For example, the data contains the start node OSMID and end node OSMID that form the edge, highway type of the edge, edge length, and so forth.

C. Data Preprocessing and Integration

After collecting the information from OpenStreetMap, we conducted feature selection. We have selected the features related to accident proneness empirically, including length, maximum speed, oneway, highway, bridge, lanes, ref, junction, access, service, and tunnel. These are the keys in the OpenStreetMap dataset.

As shown in Figure 1, we divided the input parameters in three types, which contains road network structure, road installations and road local properties. We could make good use of the obtained features and utilize them. For the road network structure, it will be discussed in the next section. In this section, we discuss the transformation of features from above to entity embedding, which includes road installations and road local properties. For road installations, we chose the features of oneway, highway, bridge, lanes, ref, junction, access, service, and tunnel. If it is a categorical feature, it will be one-hot encoded. Otherwise, the numerical value will be retained.

Other than the input features, we should also consider the preparation of accident mapping in the dataset.

In fact, the raw data crawled from the news is dirty, which means the content is in various data formats, and it cannot be used before data cleaning and filtering. Data filtering and data integration are benefits to help extract meaningful traffic accident data from the raw data.  First, we retrieved the name list of all roads from the OpenStreetMap dataset (it only contains the road information of our desired area) and removed all duplicated names inside the dataset. Then, we filtered the traffic accident dataset (it contains all accident data in Hong Kong) with the name list of all roads so that the accident data outside our desired area can be removed. After that, we defined some filtering keywords so that the accidents other than traffic accidents (e.g. pipe burst) can be removed from the accident dataset. This accident dataset was cleaned and ready to integrate with the OpenStreetMap dataset as well as performing accident data mapping.

For the output target, we defined the accident prone as 0 or 1 for whether an accident has happened. Since there is no official and rich dataset for us to do prediction, and we are not sure the scale and exact location of the data crawled from news. Therefore, mapping 0 or 1 for the involved area for whether an accident happened is the most feasible way, and we call it hot-zone mapping.

Figure 2: Mapping accident hot-zone with intersection

Figure 3: Mapping accident hot-zone with the point on a road

D. Road Network Structure Representation Learning

Our idea is to use the road network structure with various weights as the input features for training the model to predict traffic accidents. Node2vec is then our network embedding method of choice since it relies solely on network structure while optimizing for the core property of neighborhood preservation in the embedding space, a property shared by most network embedding methods. So that, node2vec is applicable when little or no attribute information is available in the road network, as is the case in our data set.

Extending the dataset can help to enrich the input features of the model on predicting traffic accidents. After decision-making about the weight used in the Node2vec model, we extract the data from the integrated dataset of the OpenStreetMap. Then transform the corresponding data into the correct data format for building the Node2vec node embedding models.

Since our purpose is to use the edges as roads in the road network structure, we have to do one more step to make the node embedding representation model to the edge embedding representation model. We use the Hadamard transform to combine the two node-embedding models directly because both node-embedding models have the same matrix size. So, there is no need to do an extra process to transform the matrix. During the Hadamard transform process, we use the addition between the two matrices rather than doing multiplication. Because the matrix may contain a zero number, which may cause the non-zero value in the matrix to be a zero number, so we decide to use addition instead of multiplication to prevent this issue.

E. Dense Layer Classification Modelling

Keras is a deep learning model framework, it is extendable and easy to use. It may be very difficult to create a CNN model under TensorFlow but it is easy to create a CNN model under keras. Different from the tensorflow provided model,e.g: the logistic model, the user can adjust the number of layers of neurons according to the complexity of the real problem. Moreover, keras model allows multiple input layers which can make the model distinguish different types of data and enhance its performance. Keras are usually used in multiple classifications.

First, we need to extract the data to be our features,since the dataset is already processed , we just need to extract data from csv and node2vec model direct.Then we can design the structure of the keras model according to number of features, then we need to try different epochs and number of input layers and units, and optimizer to get a relatively good performance of the model. If there are too many features, then the number of dense layers and neurons should be more.  In this project, we evaluate the model by f1 score. For data processing, it is better to apply one-hot encoding to all categorical data because some machine learning models don’t accept strings as input.

Evaluation

Performance Evaluation

Because the dataset is unbalanced, positive sample is about 62%, negative sample is about 38%. Therefore, we cannot mainly use accuracy to evaluate our model. We want to cover both recall and precision, since we think that the prediction of correct target is important as the predicted value cover the real life sample. Because of an unbalanced dataset, we choose micro f1 score instead of macro f1 score. We evaluate our deep learning model by testing data. The micro f1 score is 0.8642895156998404 and the loss is 0.3413464426994324. In ROC curve, the true positive rate is higher than false positive rate. Therefore, our trained model can predict whether the road structure/road installation will cause accident or not successfully.

Figure 4: Classification Report 

Figure 6: Confusion Matrix

Figure 5: ROC Curve

Conclusion

In conclusion, we could address the big research question which is “How could we predict the accident proneness of a road segment or location based on road network structure, road installations, and road local properties?”

Our experiments and evaluation indicate that road network structure, road installations, and road local properties could predict accident proneness. The deep learning graph embedding algorithms (Node2vec) is an effective approach to learn the road network structure by the model.

We designed an input model including road structure embedding and road entity embedding as the input parameters. On top of input parameters, we designed the hot-zone mapping approach to label the dataset with whether an accident existed or not. Through training the deep machine learning model (dense layers) and conducting several experiments, we found that road network structure, road installations, and road local properties could predict accident proneness in our experiments.

The empirically most important features are the Node2vec embedded model with the best travel time of the road, the Node2vec embedded model with the length of the road, the bridge-type describes the road, the highway-type describes the road, the junction-type of the road, the number of lanes in the road, and the slope of the road. In our experiment, using the features together performs better than just using one single feature. We then experiment with the effectiveness of the features. We found that most of our features are effective, indicating that we have chosen effective features in the process of feature selection. 

We attempted to increase the accuracy and decrease the loss of our deep machine learning model to avoid overfitting so that the model could be more generalized.

Besides, as stated in chapter 5, there are several potential improvements for the model as well as some possible adaptations to other solutions with similar nature. Therefore, it is beneficial to find the key factors in road design contributing to accidents in different situations. Once we understand the key factors of traffic accidents, we could take valuable measures to improve traffic safety with traffic facilities.

Future Development

So far, we have tested the importance of the features. 

However, there are other ways to improve the model but not yet implemented.

First, there may be some more useful features that we have not selected. It may be

  1. We did not find it.
  2. It is difficult for us to directly extract from the currently available data. For example, traffic light cycling time. 
  3. The feature itself is difficult to obtain. For instance, how slippery each road is. 

Therefore, more potential effective features can be further developed. 

Second, most of our features are considered with just one approach to add in the deep machine learning model as an input parameter. Most of them have not been evaluated which way to add that feature is the best. We have tried to add the bending angle to the node2vec model, but because the weight of Node2vec cannot be negative, the bending angle can only be placed in the entity embedding as a part of road local properties. Bending angle is one of our features that tried to use more than one method to add it in the model. For most of the other features such as slope, we have not yet attempted to test the best way to add it in the model. How could we make the most effective use of the feature information? For the time being, we suggested another way to alter the way of adding the slope as input parameter. One feasible way is by taking the logarithm function for the input values of the slope and observing the result. Given that the slope features are numeric numbers, the numbers may not be the linear relationship. For example, -1 to -2 may not have the same effect as -2 to -3. An experiment could be conducted so that the effect of lower magnitude of the slope could be magnified while the effect of higher magnitude of the slope could be minified by taking the logarithm function for the input values. We then could evaluate the result (e.g. accuracy) after the experiment. 

Apart from the possible improvements of the model, we expect that our findings generalize to other solutions with similar nature. Through altering the parts of input parameters, model, and the output layer, the new solution could be adapted based on our existing solution. For example, if one stakeholder would like to test the relation between a long downhill road and accident proneness, we would modify the experiment design such as adding a new one-hot encoded feature indicating whether that node or edge is a long downhill road. 

Jonathan Chiu
Marketing Director
3DP Technology Limited

Jonathan handles all external affairs include business development, patents write up and public relations. He is frequently interviewed by media and is considered a pioneer in 3D printing products.

Krutz Cheuk
Biomedical Engineer
Hong Kong Sanatorium & Hospital

After graduating from OUHK, Krutz obtained an M.Sc. in Engineering Management from CityU. He is now completing his second master degree, M.Sc. in Biomedical Engineering, at CUHK. Krutz has a wide range of working experience. He has been with Siemens, VTech, and PCCW.

Hugo Leung
Software and Hardware Engineer
Innovation Team Company Limited

Hugo Leung Wai-yin, who graduated from his four-year programme in 2015, won the Best Paper Award for his ‘intelligent pill-dispenser’ design at the Institute of Electrical and Electronics Engineering’s International Conference on Consumer Electronics – China 2015.

The pill-dispenser alerts patients via sound and LED flashes to pre-set dosage and time intervals. Unlike units currently on the market, Hugo’s design connects to any mobile phone globally. In explaining how it works, he said: ‘There are three layers in the portable pillbox. The lowest level is a controller with various devices which can be connected to mobile phones in remote locations. Patients are alerted by a sound alarm and flashes. Should they fail to follow their prescribed regime, data can be sent via SMS to relatives and friends for follow up.’ The pill-dispenser has four medicine slots, plus a back-up with a LED alert, topped by a 500ml water bottle. It took Hugo three months of research and coding to complete his design, but he feels it was worth all his time and effort.

Hugo’s public examination results were disappointing and he was at a loss about his future before enrolling at the OUHK, which he now realizes was a major turning point in his life. He is grateful for the OUHK’s learning environment, its industry links and the positive guidance and encouragement from his teachers. The University is now exploring the commercial potential of his design with a pharmaceutical company. He hopes that this will benefit the elderly and chronically ill, as well as the society at large.

Soon after completing his studies, Hugo joined an automation technology company as an assistant engineer. He is responsible for the design and development of automation devices. The target is to minimize human labor and increase the quality of products. He is developing products which are used in various sections, including healthcare, manufacturing and consumer electronics.

Course Code Title Credits
  COMP S321F Advanced Database and Data Warehousing 5
  COMP S333F Advanced Programming and AI Algorithms 5
  COMP S351F Software Project Management 5
  COMP S362F Concurrent and Network Programming 5
  COMP S363F Distributed Systems and Parallel Computing 5
  COMP S382F Data Mining and Analytics 5
  COMP S390F Creative Programming for Games 5
  COMP S492F Machine Learning 5
  ELEC S305F Computer Networking 5
  ELEC S348F IOT Security 5
  ELEC S371F Digital Forensics 5
  ELEC S431F Blockchain Technologies 5
  ELEC S425F Computer and Network Security 5
 Course CodeTitleCredits
 ELEC S201FBasic Electronics5
 IT S290FHuman Computer Interaction & User Experience Design5
 STAT S251FStatistical Data Analysis5
 Course CodeTitleCredits
 COMPS333FAdvanced Programming and AI Algorithms5
 COMPS362FConcurrent and Network Programming5
 COMPS363FDistributed Systems and Parallel Computing5
 COMPS380FWeb Applications: Design and Development5
 COMPS381FServer-side Technologies and Cloud Computing5
 COMPS382FData Mining and Analytics5
 COMPS390FCreative Programming for Games5
 COMPS413FApplication Design and Development for Mobile Devices5
 COMPS492FMachine Learning5
 ELECS305FComputer Networking5
 ELECS363FAdvanced Computer Design5
 ELECS425FComputer and Network Security5