This website uses cookies so that we can provide you with the best user experience possible. Cookie information is stored in your browser and performs functions such as recognising you when you return to our website and helping our team to understand which sections of the website you find most interesting and useful.
Font Size:
Introduction
Key Features
Uniqueness
Frequently Asked Questions
Open-Source?
Registration Needed?
Installation Required?
AI-empowered?
Specifications
URL:
Country or Region:
Author(s):
Availability:
Operating System(s):
Language(s):
Registration Needed:
Installation Required:
Video Demonstration
User Guide
This guide outlines how to use MyLens AI to automatically generate, customise, and share interactive visualisations from your data, text, or ideas.
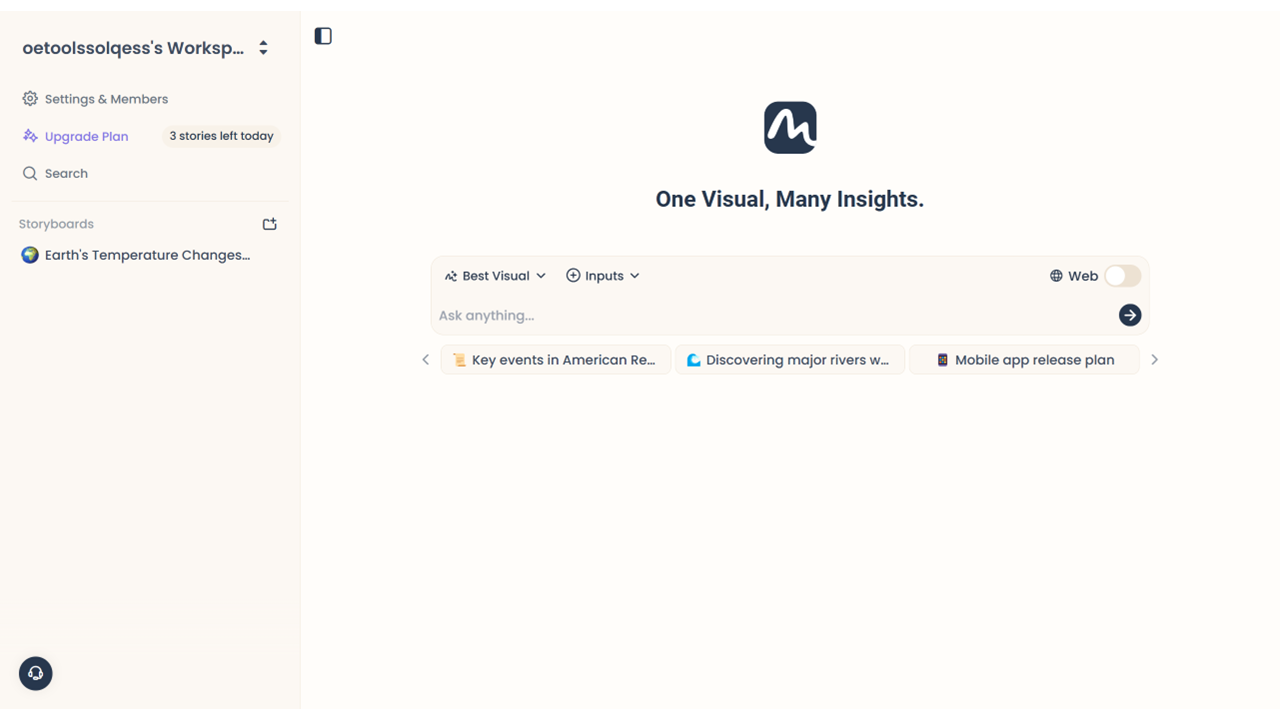
Access Mylense Website
| a. | Navigate to the website: https://mylens.ai/; |
| b. | Click Get Started to log in or register with Google account or email. |
Upload and Visualise Data
| a. | Select an input source from the buttons above the input field (Note: Support PDF, URL, YouTube, Image, Text, Spreadsheet, and web search); |
| b. | Paste the data into the input field or complete the file upload; |
| c. | Select a visual type from the dropdown list, for example, Timeline or Mind Map; |
| d. | Click the Send icon; |
| e. | Preview the interactive result that appears on your screen (Note: The free plan allows for the generation of three visualisations daily). |
Edit and Share Visualisation
| a. | Edit the Style, Font, and Size of the elements using the top toolbar; |
| b. | Click on an element in the chart and enter a prompt in the dropdown list to command the AI to edit the text in the element; |
| c. | Click the Edit Visual button to enter the AI editing mode; |
| d. | Enter the prompt in the text field and press Enter; |
| e. | Preview the modified visualisation and click the Apply button to accept the changes; |
| f. | Click the Present button in the upper-right corner to display your visual in full-screen and press Esc to exit; |
| g. | Click the Share button to generate a sharing link; |
| h. | Click the Download button, select a background colour in the context menu, and click Download to export the visual as a PNG file. |
Educational Scenarios
Educators' Perspectives
Learners' Perspectives