| |
| |
| |
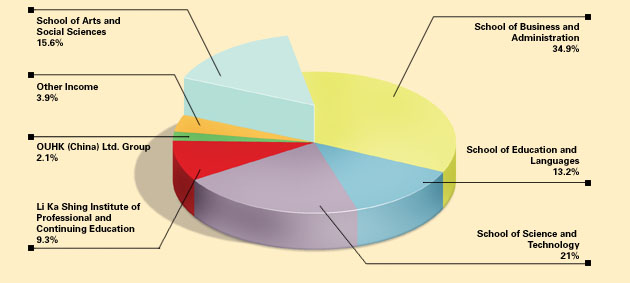
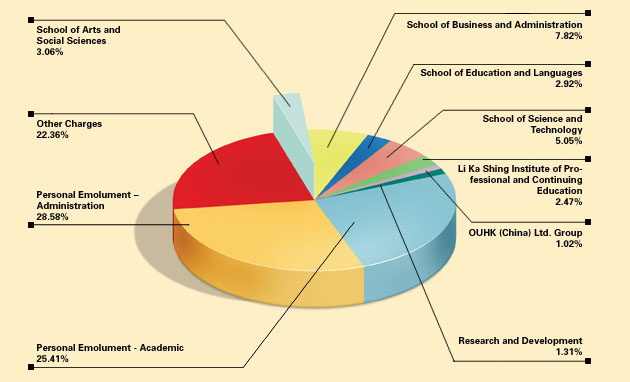
Income
and Expenditure Statements (for
the year ended 31 March 2003)
Expressed in Hong Kong dollars
|
|
|
| |
| |
2003
$’000
|
2002
$’000
|
2003
$’000
|
2002
$’000
|
|
| |
|
Fee Income
Consultancy Fee Income
Interest and Investment Income
Miscellaneous Income
|
|
486,024
|
507,823
|
486,024
|
507,823
|
|
10,730
|
8,596
|
--
|
--
|
|
5,258
|
10,241
|
5,165
|
10,158
|
|
8,048
|
4,470
|
8,251
|
5,560
|
|
|
|
|
| |
| Total
Operating Income |
510,060
|
531,130
|
499,440
|
523,541
|
|
|
| |
|
Course Materials
Tutors' Costs
Direct Student Costs
Staff Costs
Recoup to Academic Development Reserve
Research and Development
General Expenses
|
|
28,192
|
27,306
|
25,434
|
26,091
|
|
70,971
|
71,091
|
70,971
|
71,091
|
|
22,747
|
21,128
|
22,281
|
20,929
|
|
126,024
|
126,650
|
126,024
|
126,650
|
|
30,519
|
31,789
|
30,519
|
31,789
|
|
6,500
|
13,000
|
6,500
|
13,000
|
|
2,550
|
2,301
|
2,550
|
2,301
|
 |
|
287,503
|
293,265
|
284,279
|
291,851
|
|
|
|
| |
| Administrative
Expenditure |
|
|
| |
|
Staff Costs
General Expenses
|
|
153,579
|
151,685
|
153,290
|
151,492
|
|
67,782
|
76,536
|
66,246
|
75,30
|
|
|
221,361
|
228,221
|
219,536
|
226,792
|
|
|
|
| |
|
Total Operating Expenditure
Less: Overhead Recovery
|
|
508,864
|
521,486
|
503,815
|
518,643
|
|
(12,949)
|
(13,603)
|
(12,949)
|
(13,603)
|
|
|
|
|
| |
| Net
Operating Expenditure |
495,915
|
507,883
|
490,866
|
505,040
|
 |
|
|
| |
OPERATING
RESULT BEFORE FINANCE
COST AND CAPITAL COST
EXPENDITURE |
14,145
|
23,247
|
8,574
|
18,501
|
| INTEREST
ON BANK LOAN |
(170)
|
--
|
--
|
--
|
| CAPITAL
COST EXPENDITURE |
(3,568)
|
(6,992)
|
(3,568)
|
(6,992)
|
|
|
| |
OPERATING
RESULT AFTER FINANCE
COST AND CAPITAL COST
EXPENDITURE BEFORE TAXATION |
10,407
|
16,255
|
5,006
|
11,509
|
| TAXATION |
(813)
|
(716)
|
--
|
--
|
|
|
| |
| OPERATING
RESULT AFTER TAXATION |
9,594
|
15,539
|
5,006
|
11,509
|
|
|
| |
| DONATIONS
AND BENEFACTIONS |
|
|
| |
|
Endowment Funds and Donations
Interest and Investment Income
|
|
12,946
|
12,221
|
12,946
|
12,221
|
|
6,438
|
9,226
|
6,438
|
9,226
|
|
|
19,384
|
21,447
|
19,384
|
21,447
|
|
|
|
| |
|
Expenditure on Capital Projects
Expenditure Met from Donations and
Benefactions
|
|
1,969
|
6,686
|
1,969
|
6,686
|
|
57,240
|
69,183
|
57,240
|
69,183
|
|
|
59,209
|
75,869
|
59,209
|
75,869
|
|
|
|
| |
DEFICIT
NOT MET FROM
DONATIONS AND BENEFACTIONS |
(39,825)
|
(54,422)
|
(39,825)
|
(54,422)
|
|
|
| |
| DEFICIT
BEFORE TRANSFER |
(30,231)
|
(38,883)
|
(34,819)
|
(42,913)
|
|
|
| |
|
General Fund
Capital Project Funds
Specific Funds
Statutory Reserve Fund
General Reserve
|
|
68
|
(50)
|
68
|
(50)
|
|
595
|
3,326
|
595
|
3,326
|
|
39,162
|
51,146
|
39,162
|
51,146
|
|
--
|
(422)
|
--
|
--
|
|
(9,500)
|
(14,971)
|
(5,000)
|
(11,371)
|
|
|
|
|
| |
| |
30,325
|
39,029
|
34,825
|
43,051
|
|
|
|
| |
NET
SURPLUS TRANSFERRED TO
RECURRENT ACCOUNT |
94
|
146
|
6
|
138
|
|
|
|
|
|